
Bitcoin (BTC) is trying to regain its momentum today, in the meantime, altcoins may hype for a recovery phase. The cryptocurrency market, especially Bitcoin, showcases positive signs to the crypto traders’ community. However, the Ethereum coin, the second-largest crypto asset after Bitcoin, lost 1.15% of its market capitalization in the intraday trading session.
It’s just a matter of time to see if investors book their profit amid the high volatility factor of the cryptocurrency market during the intraday trading session. This article will cover some interesting facts and charts along with technical analysis of the following cryptocurrencies: Bitcoin, Ethereum, Cardano, Sandbox, Decentraland. Now moving on to the daily cryptocurrency performance chart by coin360.com.
The above heat map clearly forecasts different cryptocurrencies with their positions and their market dominance. Bitcoin shines on the chart with its 42.22% of market dominance all over the cryptocurrency market. However, some of the altcoins are recovering to their level best, and the remaining are trying to gain stability throughout the chart.
The technical analysis of different cryptocurrencies will help you understand their price prediction. The following chart analysis will acknowledge you thoroughly about the current market standings and the effects of single news over different cryptocurrency charts.
BTC/USD Chart Analysis
Bitcoin (BTC) is still caged inside a symmetrical triangle over the daily chart. BTC investors have been waiting for the recovery of the crypto asset for so long. The consolidation phase can be seen inside the symmetrical triangle pattern, and due to bitcoin’s consolidation, other altcoins in the cryptocurrency market have to pay the debt.
BTC is presently CMP near $38,700 and has gained slightly upto 0.75% of its market capitalization in the last 24-hour period. Meanwhile, trading volume increased by 16.74% in the intraday trading session. The Volume to market cap ratio is 0.03246. The highest and lowest hits by BTC in the last 24-hour period are $39,800 and $38,650, respectively. Bitcoin again struggles to break out of the psychological barrier of the $40,000 mark. Bitcoin price hasn’t changed much in the last 24-hour and has been consolidating between $39,800 and $38,650, a comparatively lower change in BTC price.
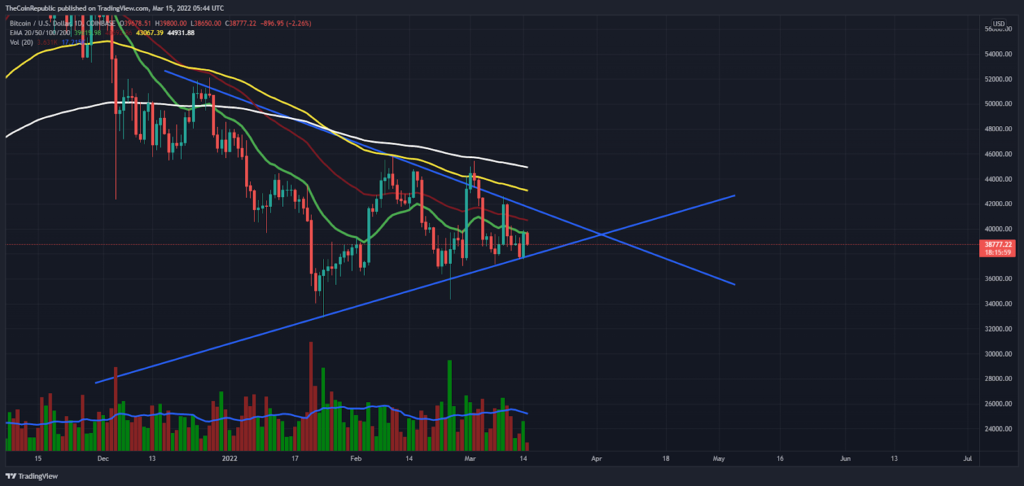
Bitcoin price is sideways inside a symmetrical triangle pattern over the daily chart. Investors are waiting for BTC’s escape from the mentioned pattern it’s been trading in. Bulls are on the move to rescue BTC, but there is low traders involvement as volume change can be seen below average and needs to grow during the intraday trading session. Bitcoin has currently recovered till 20 SMA, and further on, the remaining bullish hurdles will be 50, 100 and 200-days DMA. The cryptocurrency market may witness a hype if bulls succeed in taking BTC out of the consolidation phase with a strong uptrend. As soon as bulls succeed in breaking bitcoin out of the $40,000 psychological barrier, any directional change can be observed afterwards.
ETH/USD Chart Analysis
Ethereum coin price is trading inside a symmetrical triangle pattern over the daily chart. ETH coin is presently CMP at $2558 and has lost 0.56% of its market capitalization in the last 24-hour period. However, trading volume has increased by 4.33% in the intraday trading session. This signifies the buyers are getting involved in trade and starting the trading session with determined hopes for the recovery of the ETH coin. The Volume to market cap ratio is 0.03609.
Ethereum coin has been consolidating in the symmetrical triangle pattern from the past few trading sessions. ETH coin needs to move out of the consolidation phase and attract more buyers to exhibit any directional change to ETH investors.
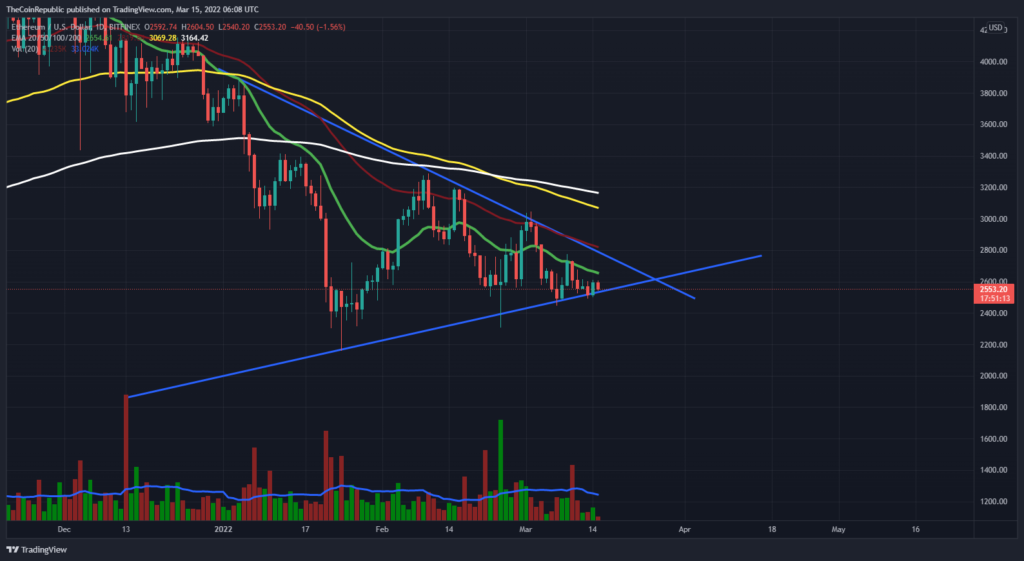
ETH Coin is trading inside a symmetrical triangle pattern with sideways momentum and needs to move up to break out of the downward sloping line of the triangle. ETH Coin price stands below 20, 50, 100 and 200-days Daily Moving Average. The volume change is below average and needs to grow for the coin to escape from the consolidation phase and be strongly bullish over the chart. The highest and lowest hits by ETH in the last 24-hour period are $2604 and $2540, respectively. Ethereum investors in the cryptocurrency market need to wait for any directional change over the daily chart.
ADA/USD Chart Analysis
Charles Hoskinson, the founder of the Cardano project, shared a tweet that talks about 517+ projects that are now building on Cardano as the ADA continuation in the growth of the ADA ecosystem. Hoskinson shared his thoughts by narrating, “Moving the chains. A large wave will come after June when the Vasil hard for happens”.
The Cardano founder informed ADA enthusiasts about Vasil Hardfork. Let us understand Vasil Hardfork and Aftermath: The upgrade in question will be released in June and named after Vasil Dabov, a late Bulgarian mathematician and Cardano Ambassador. In October, there will be another improvement. Pipelining, new Plutus CIPs, UTXO on-disk storage, and Hydra are among the scaling features IOG aims to implement. According to the company, Cardano’s throughput is expected to improve as a result of these improvements. The system will be optimized to work with a growing number of DeFi apps, smart contracts, and DEXs. So, this is a Cardano project, or we can say an upgrade.
The Cardano network has gained significant traction in terms of total locked value (TVL), which has been steadily increasing since the start of the year.

The total value locked of Cardano (ADA) on DeFi Llama is 190.57M with a 24-hour positive change of +4.24%.
Moving back to the chart analysis of ADA/USD:
Cardano (ADA) Coin price is trading in a falling wedge and struggling to get support in the lower levels over the daily chart. ADA coin is presently CMP at $0.78 and has lost about 2.02% of its market capitalization in the last 24-hour period. The trading volume decreased by 18.12% in the intraday trading session. The Volume to market cap ratio is 0.0312.
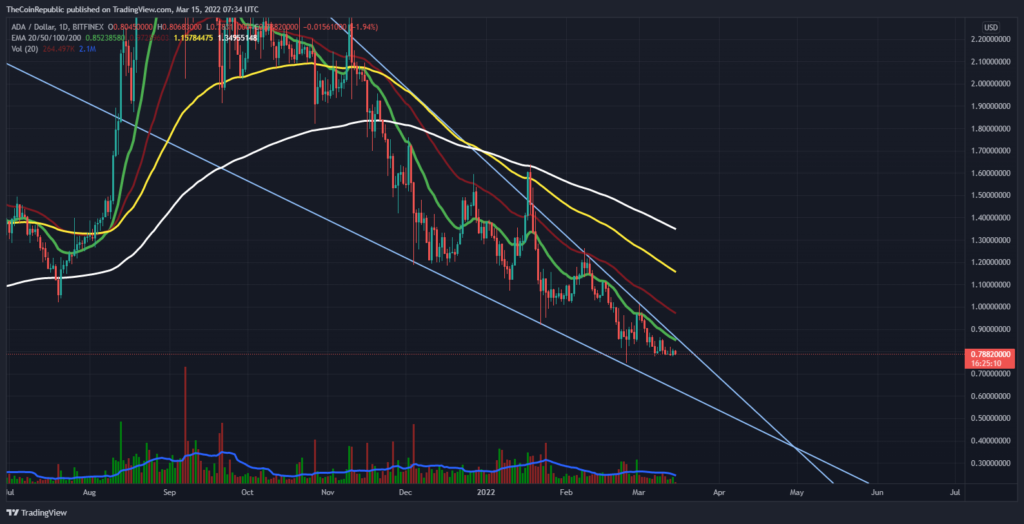
ADA coin has been trading in a falling wedge pattern over the daily chart. ADA coin price is currently trading below 20, 50 100 and 200-days Daily Moving Average. Volume change is below average and needs to grow for the coin to gain support and trade upwards to escape from the falling wedge pattern.
SAND/USD Chart Analysis
On the Ethereum blockchain, The Sandbox, which is majority-owned by blockchain game startup Animoca Brands, allows participants to create, control, and monetize virtual gaming experiences. It gives creators equity in the form of NFTs and gives them tools to produce assets on the network.
SAND Coin price is trading inside a descending triangle pattern over the daily chart. The SAND coin is presently CMP at $2.68 and has lost about 2.88% of its market capitalization in the last 24-hour period. The trading volume has also decreased by 4.37% in the intraday trading session. SAND needs to attract traders to escape the descending triangle pattern. The Volume to market cap ratio is 0.1374.
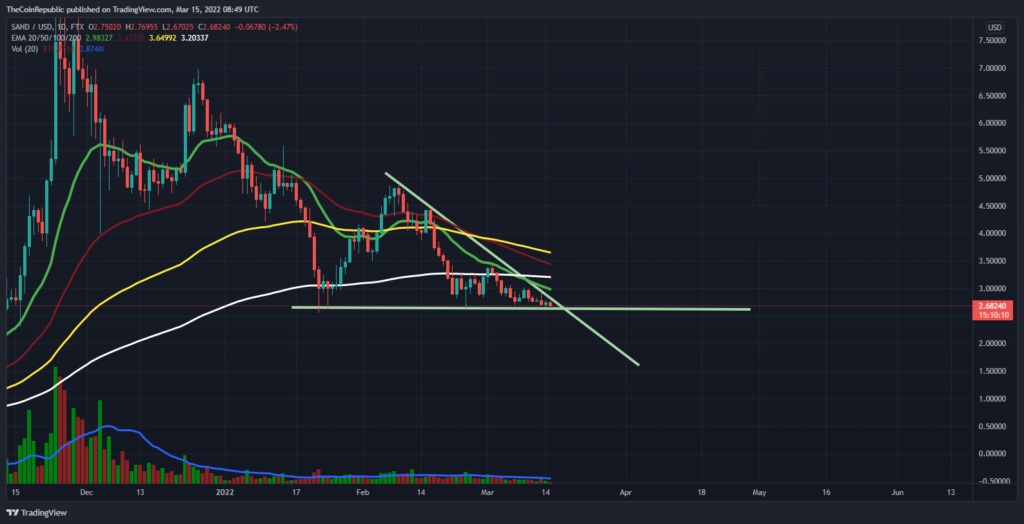
SAND Coin price has been consolidating in a descending triangle pattern over the daily chart. SAND needs to attract more buyers to escape the consolidation phase and move out of the declining triangle. The crypto asset is trading below 20, 50, 100 and 200-days DMA. The volume change over the chart is below average and needs to grow for SAND to escape consolidating. SAND investors may expect any directional change over the chart as soon as trading volume increases. However, SAND is said to be a risky investment as its significance is only based on its game, which may defer the future preferences of SAND investors.
MANA/USD Chart Analysis
The Decentraland virtual reality platform is powered by the Decentraland (MANA) Ethereum coin. MANA can be used to purchase both virtual land plots and in-world products and services in Decentraland.
Decentraland is a virtual reality platform that allows users to develop and monetize content and applications in three dimensions. Decentraland is a blockchain-based platform that promises to create a network owned by its users and offers an immersive experience. Users can purchase virtual pieces of land on the platform, a shared metaverse.
MANA Coin is presently CMP at $2.22 and has lost 3.03% of its market capitalization in the last 24-hour period. Meanwhile, trading volume has also decreased to 8.85% in the intraday trading session. The Volume to market cap ratio is 0.07014.
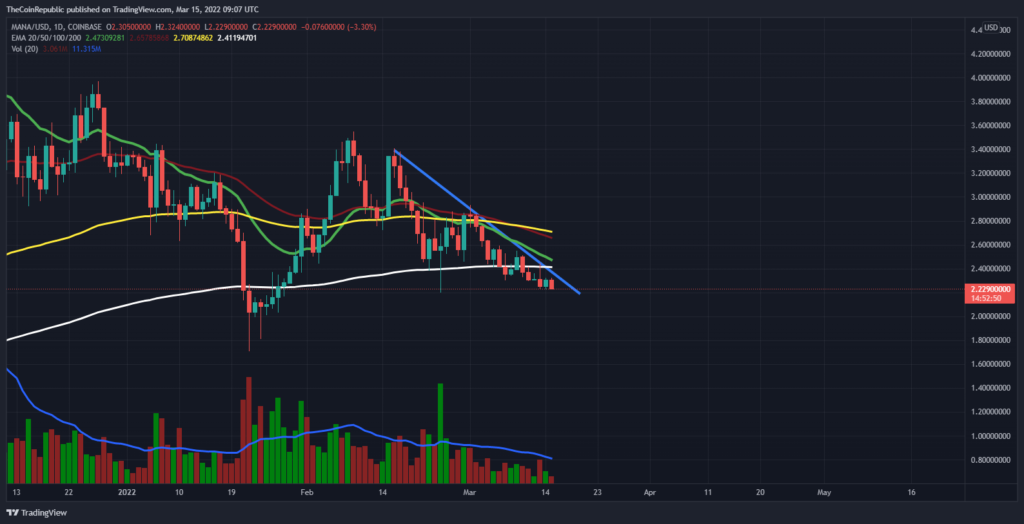
MANA Coin price is sideways below a downward sloping line over the daily chart. MANA needs to attract more buyers to escape the consolidation phase over the chart. MANA token has been falling below the downward sloping line since 16th February. MANA needs to recover from the lower levels to break the downward sloping line. If bulls succeed in sustaining at the verge of the neckline, then MANA may set a primary resistance level of $3.00 in the near future. MANA has been a centre of attraction in the cryptocurrency market as crypto investors trust the virtual reality platform of Decentraland as it’s co-powered by MANA.
A strong message to all the cryptocurrency market investors, Don’t let the high volatility factor of the Cryptocurrency market bargain with your profit.
Disclaimer
The views and opinions stated by the author, or any people named in this article, are for informational ideas only, and they do not establish financial, investment, or other advice. Investing in or trading crypto assets comes with a risk of financial loss.

This news is republished from another source. You can check the original article here


