It was a sea of red in cryptocurrencies as geopolitical and interest rate risks emerged. Bitcoin price crashed below $19,000 while Ethereum plunged below $1,300. Most digital coins were deep in the red, which pushed the total market cap of all cryptocurrencies to about $900 billion. So, how will Stellar Lumens (XLM), Polygon (MATIC), and Chainlink (LINK) trade during the weekend?
Stellar Lumens price prediction
Stellar price has been in a strong bearish trend in the past few weeks. A closer look at the four-hour chart shows that it formed a double-top pattern at $0.1300. In price action analysis, this pattern is usually a bearish sign.
The coin is trading at $0.1090, which is slightly above the neckline of this double-top pattern. At the same time, it has moved below the 25-day and 50-day moving averages. The Relative Strength Index (RSI) has moved below the neutral point at 50.
Stellar is also flashing red on the Supertrend indicator. Therefore, there is a likelihood that the coin will continue falling as sellers target the next key support level at $0.0985, which is about 10% below the current level. This price was also the lowest level in September of this year.
Read more on how to buy Stellar.
MATIC price prediction
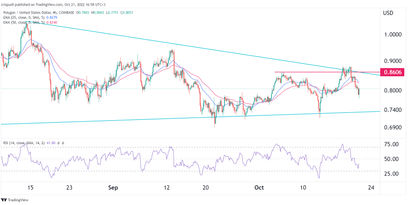
Polygon MATIC price was not left behind in the ongoing cryptocurrency sell-off. It crashed from this week’s high of $0.8830, to a low of $0.7775. As it dropped, it managed to move below the important resistance level at $0.8606, which was the lowest level on October 6 of this year.
The coin also moved below the 25-day and 50-day moving averages while the Relative Strength Index (RSI) moved below the neutral level of 50. Therefore, the path of the least resistance for Polygon is lower, with the next key support level being at $0.7400, which is along the lower side of the ascending channel shown in blue.
Read more about how to buy Polygon.

Chainlink price prediction
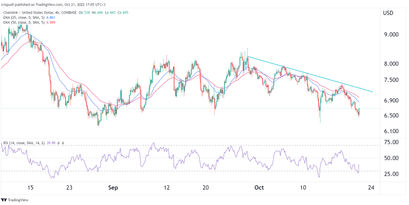
LINK price has bee in a strong downward trend despite the important updates that are coming up in the next few months. The biggest change in Chainlink 2.0 will be the ability to stake LINK tokens and earn rewards.
The four-hour chart shows that the Chainlink price has crashed below the descending trendline that is shown in green. It has also moved beow the 25-day and 50-day moving averages. The coin has also formed a head and shoulders pattern, which is usually a bearish sign.
Therefore, there is a likelihood that the coin will continue falling during the weekend as sellers target the next key support at $6.
Find out how to buy Chainlink.

This news is republished from another source. You can check the original article here


