Bitcoin Analysis
Bitcoin’s bears rejected a bullish attempt to break out of the bearish control zone on the Relative Strength Index last week and since then bearish traders have absorbed the remainder of demand. The absorption occurred during the day’s final 4HR candle on Sunday as bearish BTC traders confirmed a bearish breakdown below $19,891.
BTC’s price saw its lowest level in 42 days on Sunday and when traders settled-up at Sunday’s session close, BTC’s price was -$478.2.
The first chart we’re looking at this week is the BTC/USD 1D chart below from twenty47crypto. BTC’s price is trading between the 0.786 fibonacci [$18,905.05] and 0.618 [$29,651.72], at the time of writing.
The targets for bullish traders on the daily timescale to the upside are 0.618, 0.5 [$37,199.98], 0.382 [$44,748.24].
Bearish traders that believe there’s more downside yet on BTC have a primary target of 0.786 [$18,905.05]. Below that level the next potential support for bullish traders is the 12-month low of $17,611.
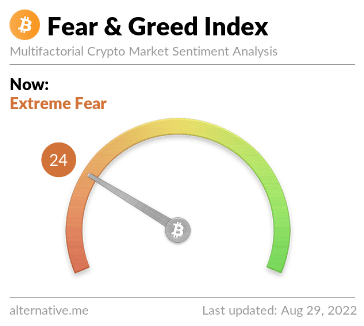
The Fear and Greed Index is 24 Extreme Fear and is -4 from Sunday’s reading of 28 Fear.

Bitcoin’s Moving Averages: 5-Day [$21,318.99], 20-Day [$22,859.9], 50-Day [$21,856.04], 100-Day [$27,385.68], 200-Day [$35,972.37], Year to Date [$33,261.23].
BTC’s 24 hour price range is $19,540-$20,169 and its 7 day price range is $19,540-$21,753.13. Bitcoin’s 52 week price range is $17,611-$69,044.
The price of bitcoin on this date last year was $48,800.
The average price of BTC for the last 30 days is $22,747.3 and its -6% over the same duration.
Bitcoin’s price [-2.39%] closed its daily candle worth $19,557.8 on Sunday and in red figures for a third day in a row.
Ethereum Analysis
Ether’s price had the worst day of the projects covered today and ETH wrapped-up its daily candle on Sunday -$64.56.
Today’s second chart is the ETH/USD 4HR chart below by RyodaBrainless. Ether’s price is trading between the 0.786 fib level [$1,457.59] and 0.618 [$1,581.11], at the time of writing.
The immediate target of bullish ETH market participants is 0.618 with a secondary target of 0.5 [$1,667.87]. The third target to the upside for bulls is 0.382 [$1,754.63] and the fourth target is 0.236 [$1,861.98].
The downside targets for bearish Ether traders are 0.786, and the 1 fib level [$1,300.25]. If bearish ETH traders are able to penetrate the $1,300 level to the downside, Ether’s price could see another drastic markdown because that level is the last level of support for its ascending channel on the 4HR timescale.

Ether’s Moving Averages: 5-Day [$1,635.13], 20-Day [$1,736.88], 50-Day [$1,464.54], 100-Day [$1,861.65], 200-Day [$2,589.97] Year to Date [$2,319.63].
ETH’s 24 hour price range is $1,422.67-$1,511 and its 7 day price range is $1,422.67-$1,713.59. Ether’s 52 week price range is $883.62-$4,878.
The price of ETH on this date last year was $3,221.81.
The average price of ETH for the last 30 days is $1,713.76 and its +2.37% over the same time frame.
Ether’s price [-4.33%] closed its daily candle on Sunday worth $1,426.2 and in red figures for the third straight day.
Binance Coin Analysis
Binance Coin’s price is also trending lower and when Sunday’s daily session closed, BNB’s price was -$1.30.
The last chart to round-out Monday’s price analyses is the BNB/USD 4HR chart below from AntoniaVie. BNB’s price is trading between 0.618 [$277.0] and 0.5 [$288.5], at the time of writing.
Bullish targets overhead for bulls of the BNB market are 0.5, 0.382 [$299.9], 0.236 [$314.0], and a full retracement back to 0 [$336.8].
Conversely, the bearish targets to the downside of the 4HR BNB chart are 0.618 , 0.702 [$268.9], 0.786 [$260.8], and 1 [$240.1].

Binance Coin’s Moving Averages: 5-Day [$296.94], 20-Day [$307.07], 50-Day [$267.37], 100-Day [$300.52], 200-Day [$398.04], Year to Date [$344.62].
Binance Coin’s 24 hour price range is $274.4-$284.1 and its 7 day price range is $274.4-$305.34. BNB’s 52 week price range is $184.1-$666.8.
Binance Coin’s price on this date last year was $479.8.
The average price of BNB over the last 30 days is $301.72 and its +13.24% over the same timespan.
Binance Coin’s price [-0.47%] closed its daily session on Sunday worth $276.5 and in negative figures for a third consecutive day.
This news is republished from another source. You can check the original article here


