- Bitcoin price returns inside the Ichimoku Cloud, mitigating a large amount of bearish momentum.
- Ethereum price prints a weekly candlestick that clearly shows an imminent bullish push.
- XRP price relatively unchanged despite market-wide volatility.
Bitcoin price action is the barometer of the aggregate cryptocurrency market, and its return inside the Ichimoku Cloud is a positive. Likewise, Ethereum price recovered nearly 20% from the Thursday crash lows, trapping a large number of short-sellers in the process. XRP price is likely to close the week lower but within a prior value area.
Bitcoin price makes an attempt at developing support
Bitcoin price action yesterday experienced some of the most volatile and wild activity of the past few months. The most critical condition that Bitcoin must maintain, going into the weekend, is to remain above the inside of the Ichimoku Cloud. That the daily closes must be above Senkou Span A.
Despite the fears over Russia’s invasion of Ukraine, Bitcoin has developed some very bullish technical levels. For example, last week, the threshold that Bitcoin needed to close at to confirm an Ideal Bull Ichimoku Breakout was at the $49,500 price level. This week that threshold has dropped considerably to $42,600.
BTC/USD Daily Ichimoku Kinko Hyo Chart
However, downside risks remain, and if there is a daily close at or below $36,800, then a confirmed Ideal Bearish Ichimoku Breakout would occur. As a result, Bitcoin price could travel below the $30,000 price level in that scenario.
Ethereum price traps bears, short-sellers entering max pain zone
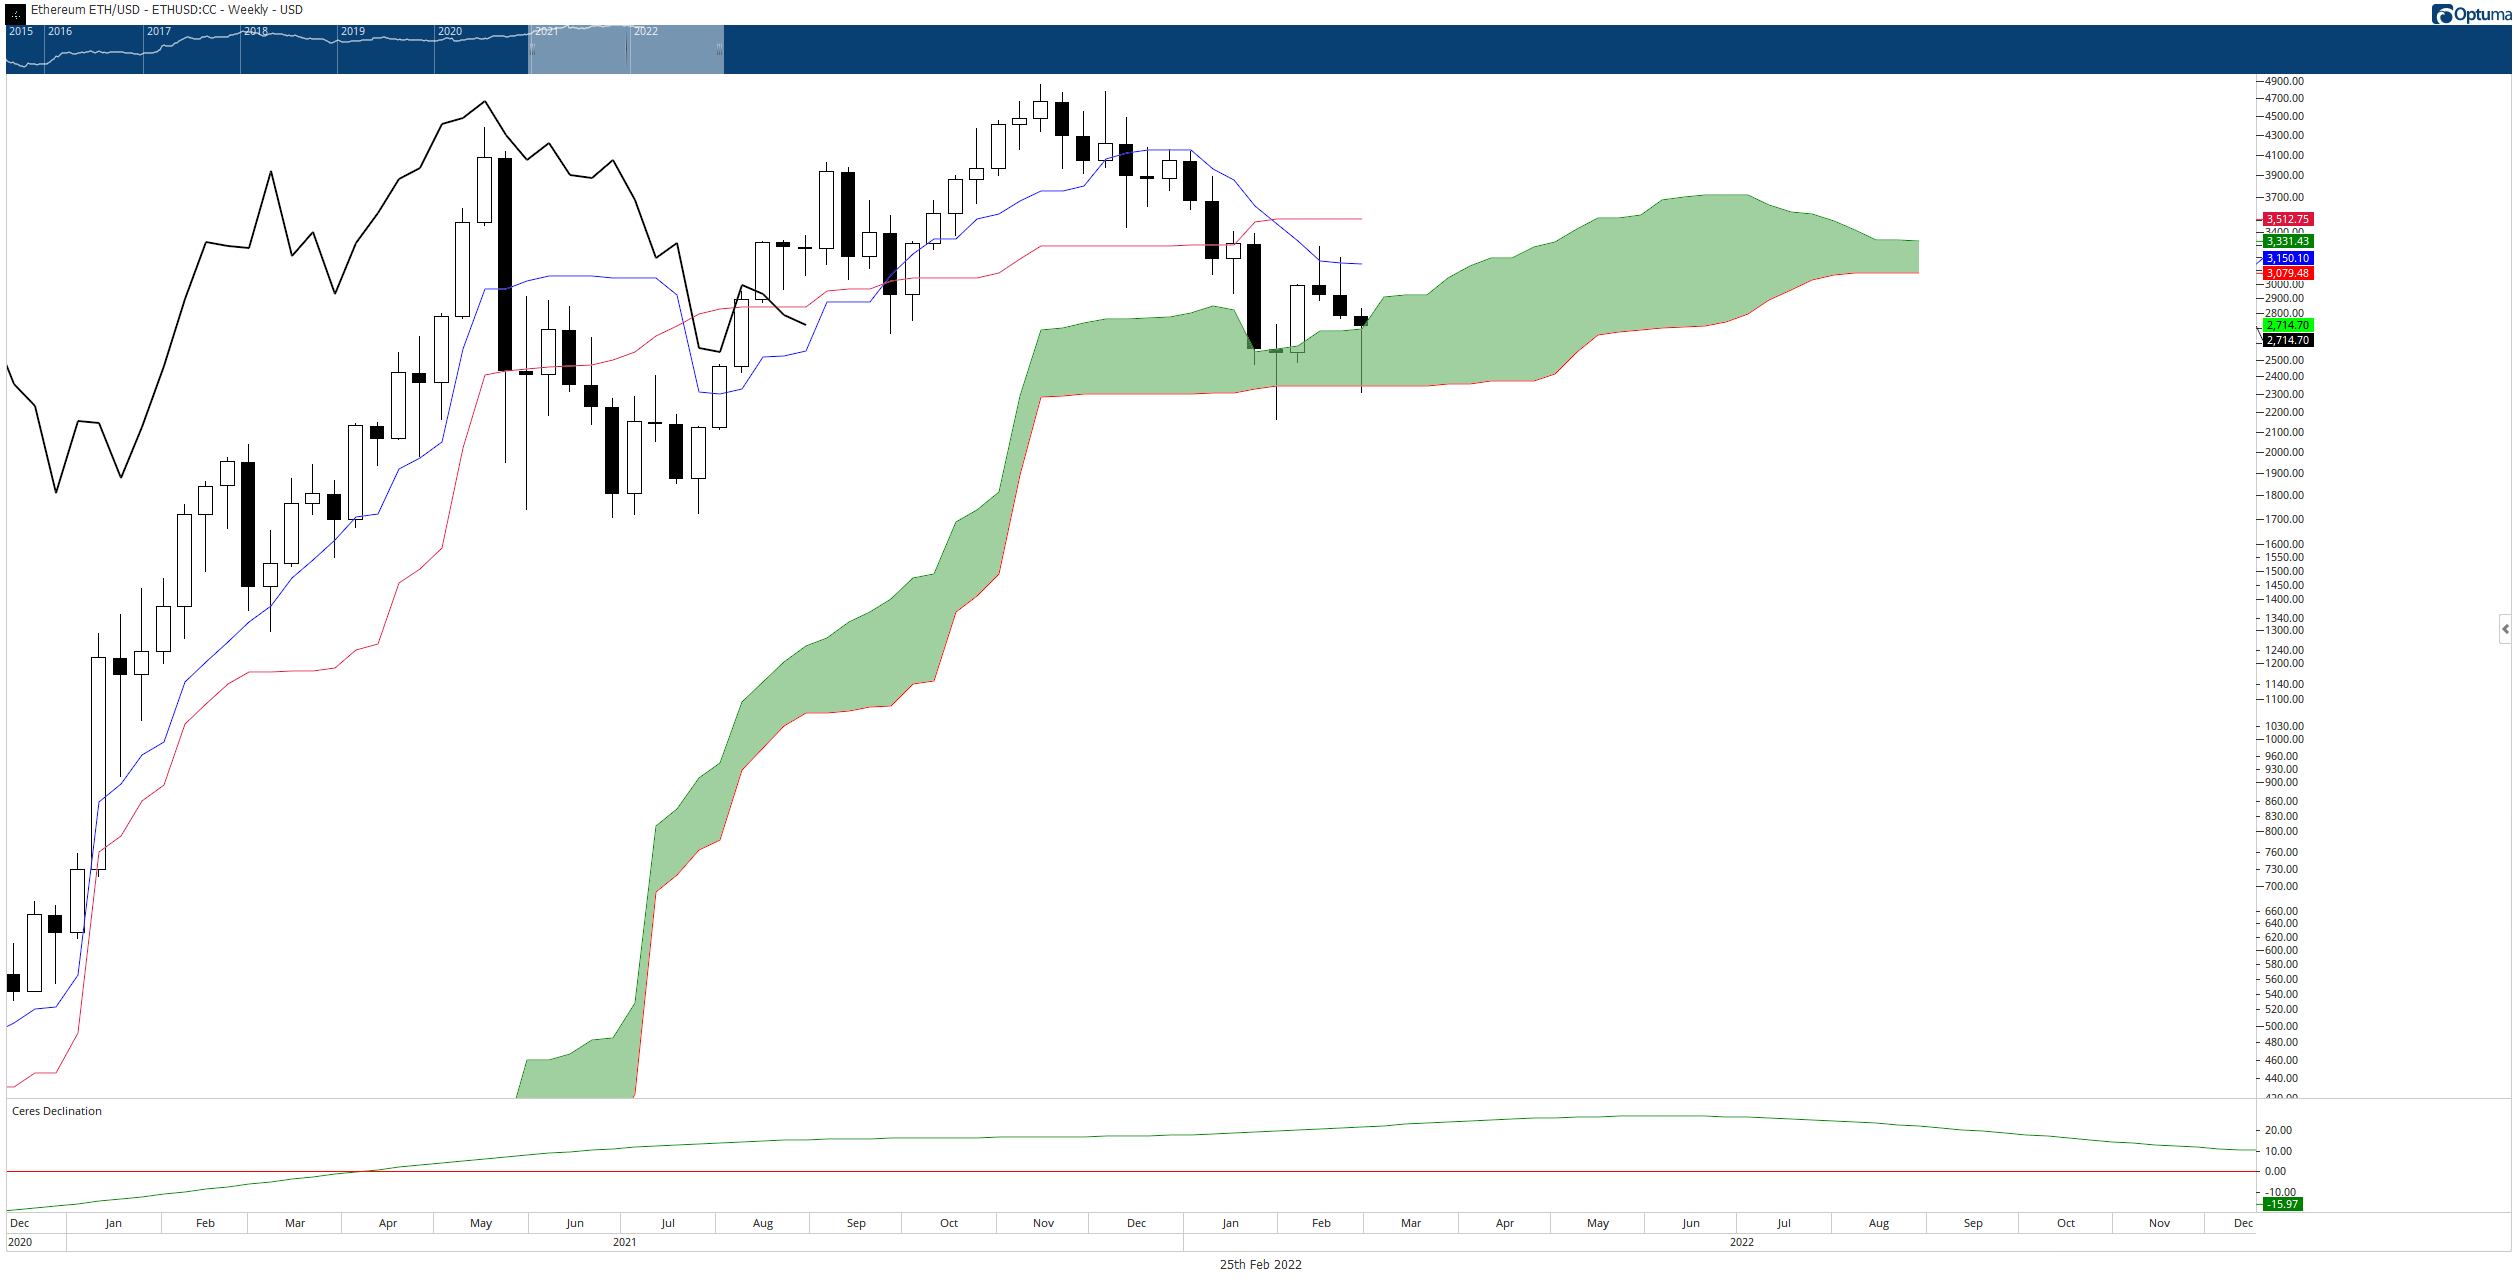
Ethereum price certainly looked like a prime shorting opportunity during the beginning of the week. Questionable strength of the $2,500 support level brought in a large number of new short-sellers.
The resulting price action from Thursday’s sell-off generated a massive 20% rally that has extended into Friday’s session. Bulls are attempting to push Ethereum price to a close above the Ichimoku Cloud, where ETH opened the current weekly candlestick.
If bulls complete a close above the Ichimoku Cloud, Ethereum price will likely target the next resistance level, the weekly Tenkan-Sen at $3,700. However, downside risks remain – this is especially true with average weekend volatility and the Russian invasion coinciding.

ETH/USD Weekly Ichimoku Kinko Hyo Chart
A close below the weekly Ichimoku Cloud at or below $2,325 would complete an Ideal Bearish Ichimoku Breakout on the weekly chart – this would likely initiate a swift crash down to the $1,800 value area, invalidating any near-term bullish outlook.
XRP price bounced more than 15% from the Thursday sell-off, buy still down for the week
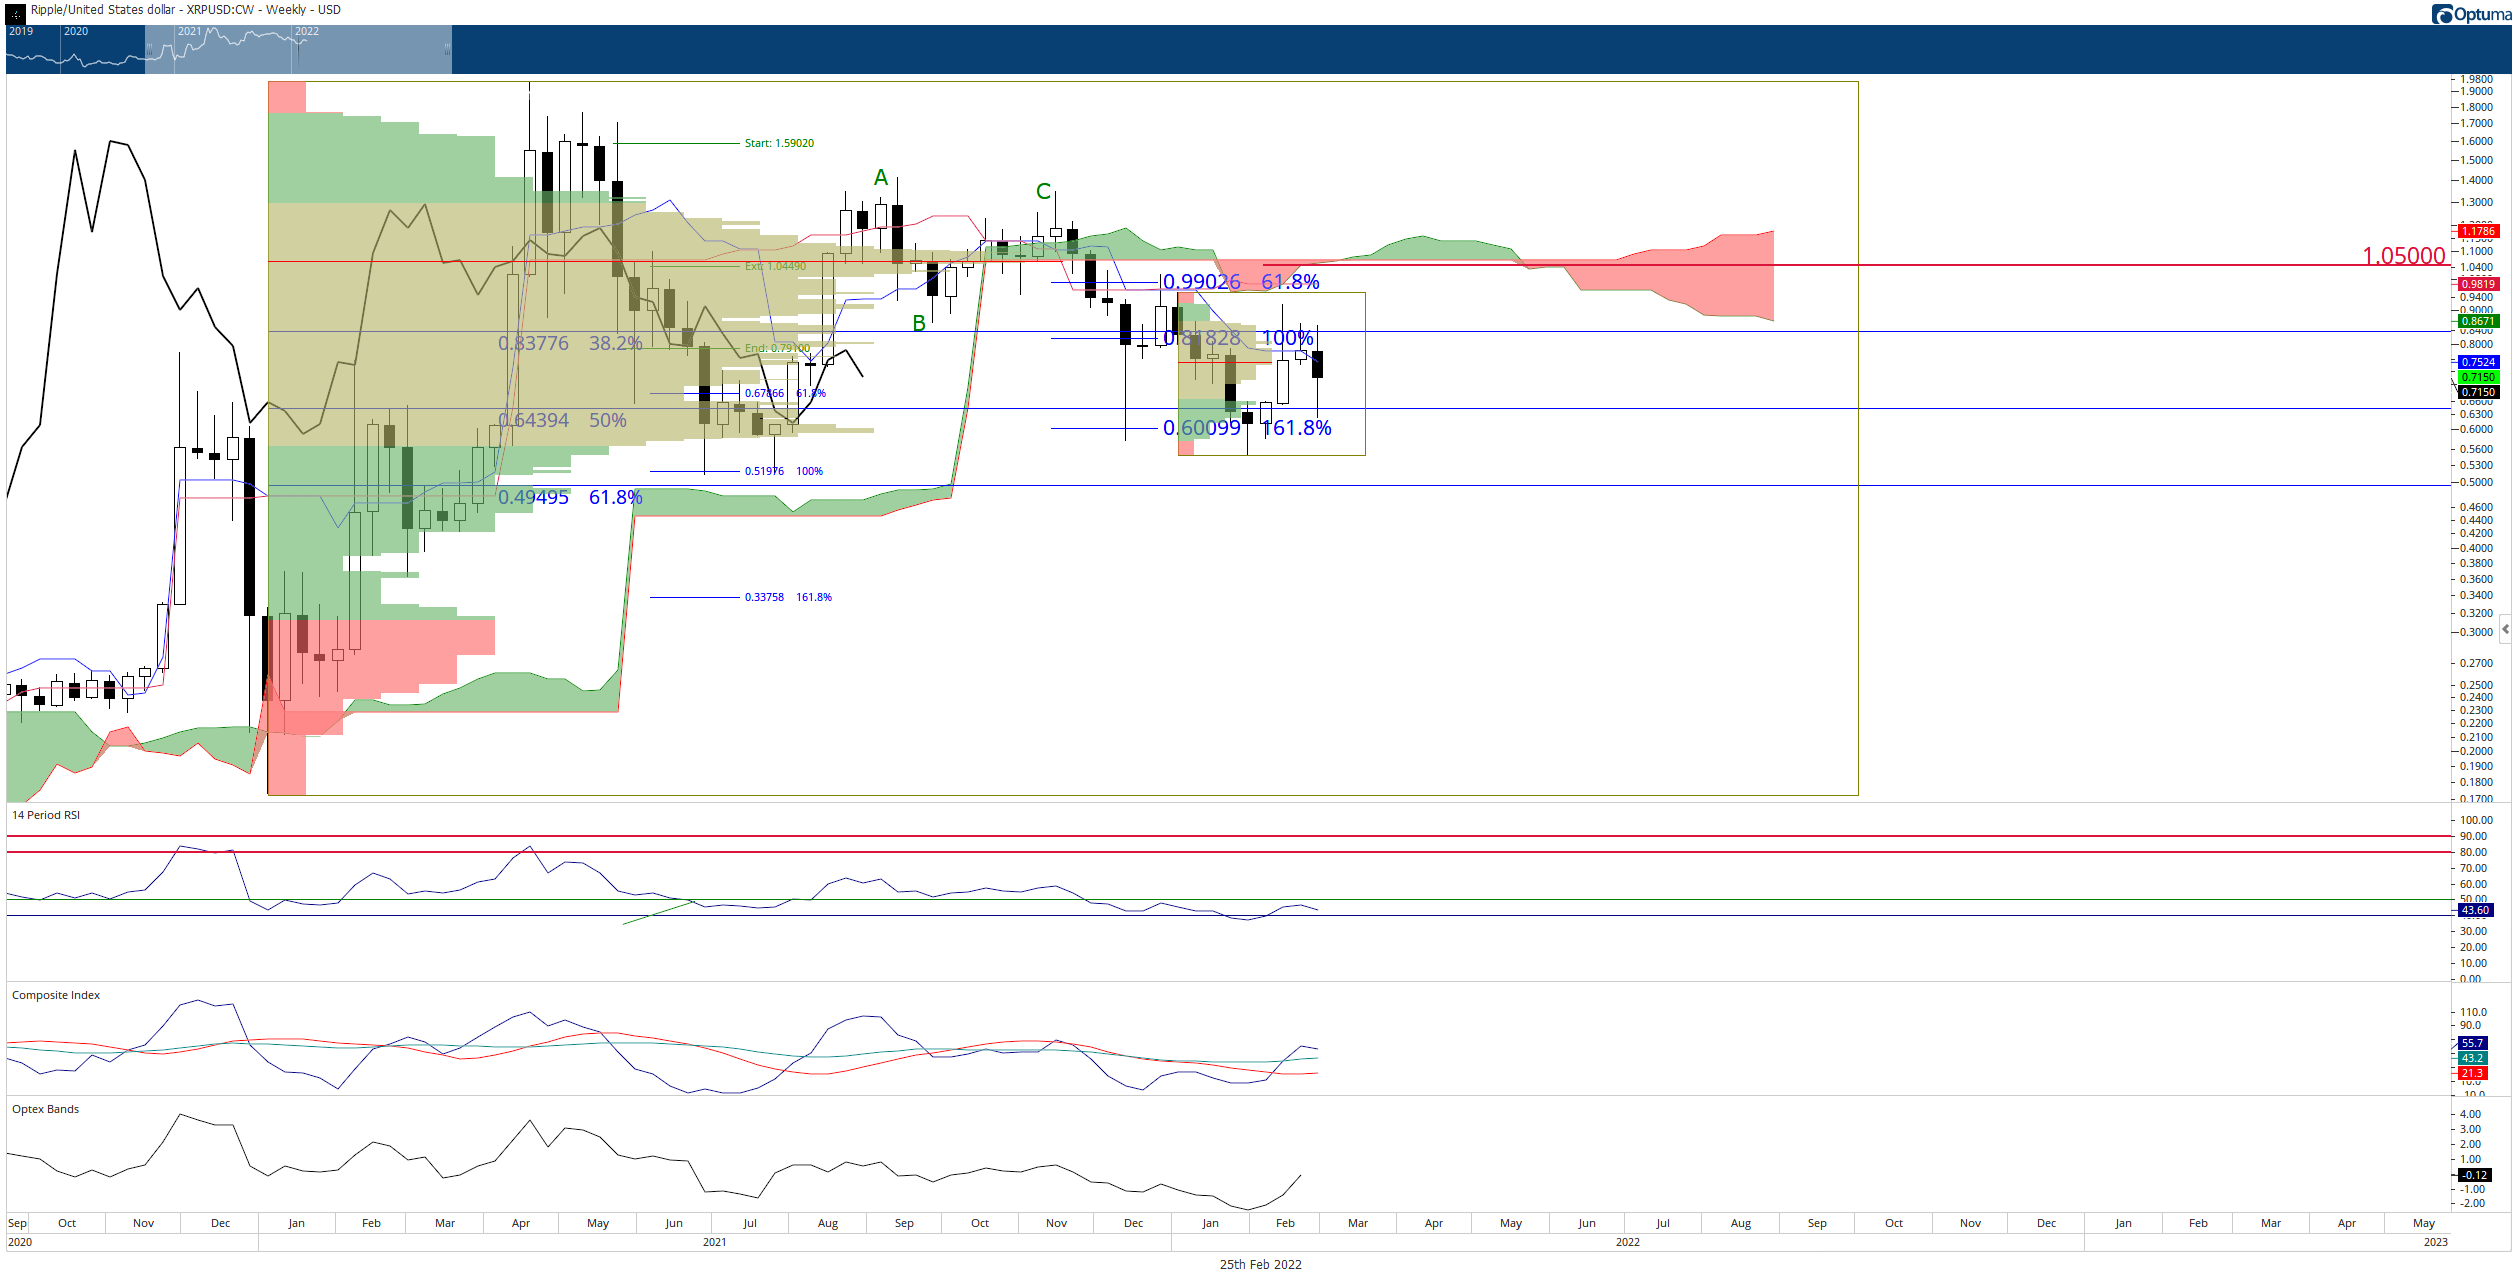
XRP price is poised to close the week between 4% and 6% down from the open but still within the range of the prior week’s open. Ripple opened last week at $0.76, and it may close this week near $0.75 – a strong psychological level. All in all, relatively unchanged.
The path to bullish conditions and a bullish breakout remains challenging for XRP price. To confirm a bullish breakout within the Ichimoku system, bulls would need to push XRP to a close above all of these resistance levels:
- The weekly Kijun-Sen at $0.98.
- The extended 2021 Volume Point Of Control at $1.05
- Senkou Span B at $1.08.
- Senkou Span A at $1.14.

XRP/USDT Weekly Ichimoku Kinko Hyo Chart
If buyers can achieve a close above those four resistance levels, XRP has a vast open space to run higher. Downside risks should be limited to the 61.8% Fibonacci retracement near the psychologically important $0.50 level.
This news is republished from another source. You can check the original article here


